
Ultraviolet (UV) radiation reaches the ground even on cloudy days, and it can affect your skin. UV strength depends on the sun’s angle, following a predictable daily rhythm: effectively zero at dawn, peaking around midday, fading to nothing by dusk. Cloud cover thins it, and it diminishes naturally through autumn and winter. The curve above shows today’s hourly UV forecast for Monkton Heathfield, with the current reading marked so you can see where you stand before gardening, walking the dog, or an afternoon at the cricket ground.
A single day’s UV tells you where you are; a run of days reveals where the season is heading. The chart below plots daily maximum UV — the solid line — alongside the daily average, shown dashed. Over months, this builds a picture of how ultraviolet exposure rises and falls at Monkton Heathfield through the year: strong, spiky peaks in summer, gentler humps in spring and autumn, and a flat trough in winter when the sun sits low. Logged daily on a fixed schedule, the record grows consistently regardless of conditions — which makes seasonal comparison meaningful.
UV Index readings are grouped into internationally recognised bands, and the same colours are used on our UV warning widget on the Today page. Low (0–2) is green — no protection needed for most people. Moderate (3–5) is yellow — seek shade around midday and wear sunscreen if out for long. High (6–7) is amber — protection is essential, so cover up. Very High (8–10) is red — take extra precautions and avoid the midday sun. Extreme (11+) is purple — a severe risk requiring full coverage, rarely if ever seen in Britain. Today’s peak reading, shown on the chart above, tells you which band applies.
By late October, UV peaks in Somerset sit in the 0.5–2 range. That is too weak to cause sunburn, but it is not zero — and those gentler doses are precisely the ones your skin uses to manufacture Vitamin D through the darker months. In summer, the balance between beneficial exposure and skin damage tips quickly; in winter, the risk shifts from burning to insufficient synthesis instead. For guidance on whether today offers a useful Vitamin D window, see the Vitamin D tab, which tracks exactly that.
As a rough local guide: a daily peak below 2 means no sunscreen is needed for short outdoor tasks like walking the dog or hanging out washing. A peak above 3 is worth respecting — seek shade between 11:00 and 15:00 and use sunscreen for extended exposure. Midwinter peaks below 1 will neither burn you nor contribute much Vitamin D, which is when the Vitamin D tab becomes the more useful reference. All readings come from the Monkton Heathfield station, updated every five minutes.
Heat Stress
Heat stress describes how hot it really feels to the human body, combining air temperature with humidity. When the air is humid, sweat evaporates more slowly, so the body’s natural cooling system works less efficiently. The result can be a “feels-like” temperature significantly higher than the thermometer reads. Our heat stress reading is calculated live from the Monkton Heathfield weather station’s own temperature and humidity sensors, using the National Weather Service heat index formula — the standard method used worldwide for assessing heat risk.
Understanding the Bands
LOW (below 24°C feels-like): Comfortable conditions for most people. No precautions needed.
MODERATE (24–29°C feels-like): Caution advised. Stay hydrated, take breaks in the shade during exertion, and watch for early signs of heat fatigue.
HIGH (29–32°C feels-like): Caution required. Limit strenuous outdoor activity, particularly during the hottest hours of the day (typically 11am–3pm).
EXTREME (above 32°C feels-like): Dangerous conditions. Avoid prolonged outdoor activity, drink plenty of fluids, and check on elderly or vulnerable neighbours and relatives.
Who Should Take Care
Heat stress affects some groups more than others: older people, young children, pregnant women, and anyone with heart or respiratory conditions. Certain medications can also reduce the body’s ability to cope with heat. If you fall into any of these groups, take the MODERATE band seriously.
Heat Stress and UV Are Different Risks
A mild day can still carry high UV, and a humid overcast day can still be dangerous for heat stress. Check both readings before planning outdoor activity — sun protection and heat protection address different problems.
How to read the numbers
Air pollution is measured on the UK Daily Air Quality Index (DAQI), a simple 1–10 scale — the lower the number, the cleaner the air.
- 1–3 Low — enjoy your usual outdoor activities.
- 4–6 Moderate — fine for most people; unusually sensitive people may notice symptoms with prolonged exertion.
- 7–9 High — adults and children with breathing or heart problems should reduce strenuous activity outdoors.
- 10 Very High — everyone should limit strenuous outdoor exertion.
Air quality is good. Enjoy your usual outdoor activities.
5-Day Forecast
Our data
We gather data from DEFRA, using the nearest available source, Crowcombe Heathfield, which lies on the same elevation band over the Somerset Levels. That makes it a reliable proxy for local conditions — the air mass affecting one affects the other. If readings rise here, expect similar trends on your doorstep.
Autumn/Winter
Wood-burning season begins in earnest as temperatures drop. Domestic heating can elevate local particulate levels, particularly in calm, cold evenings when smoke hangs low. During those periods, readings may drift toward the Moderate band even when background air quality is good. Watch for elevated forecasts on still nights, and check back if you’re sensitive to poor air.
If you have asthma, COPD, or other respiratory conditions; heart disease; you’re pregnant; or you work outdoors regularly — keep an eye on the 5-day forecast and the warning widget on the Today page. When readings reach Moderate (4–6) or higher, consider timing strenuous outdoor activity for early morning or late afternoon, when pollution levels often dip
A good day to be outdoors — pollen levels are low
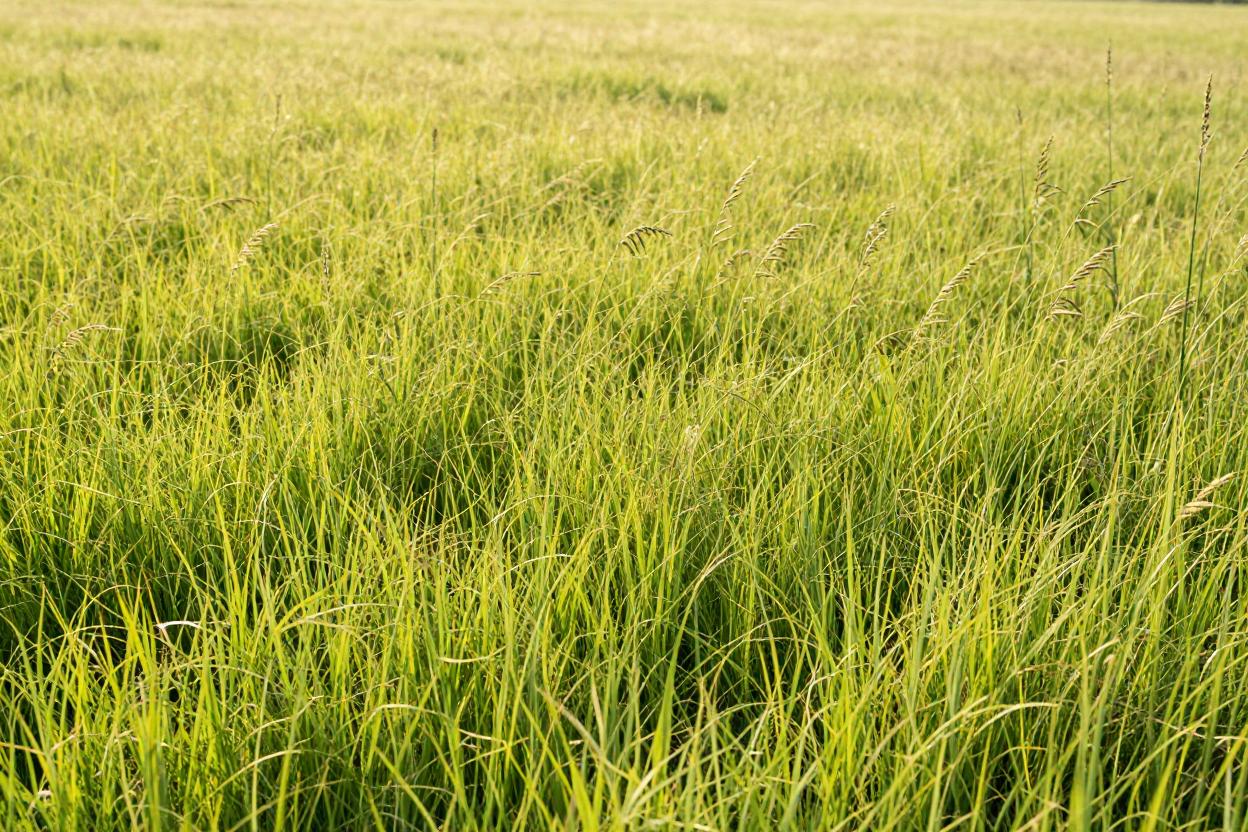 Grass: Low
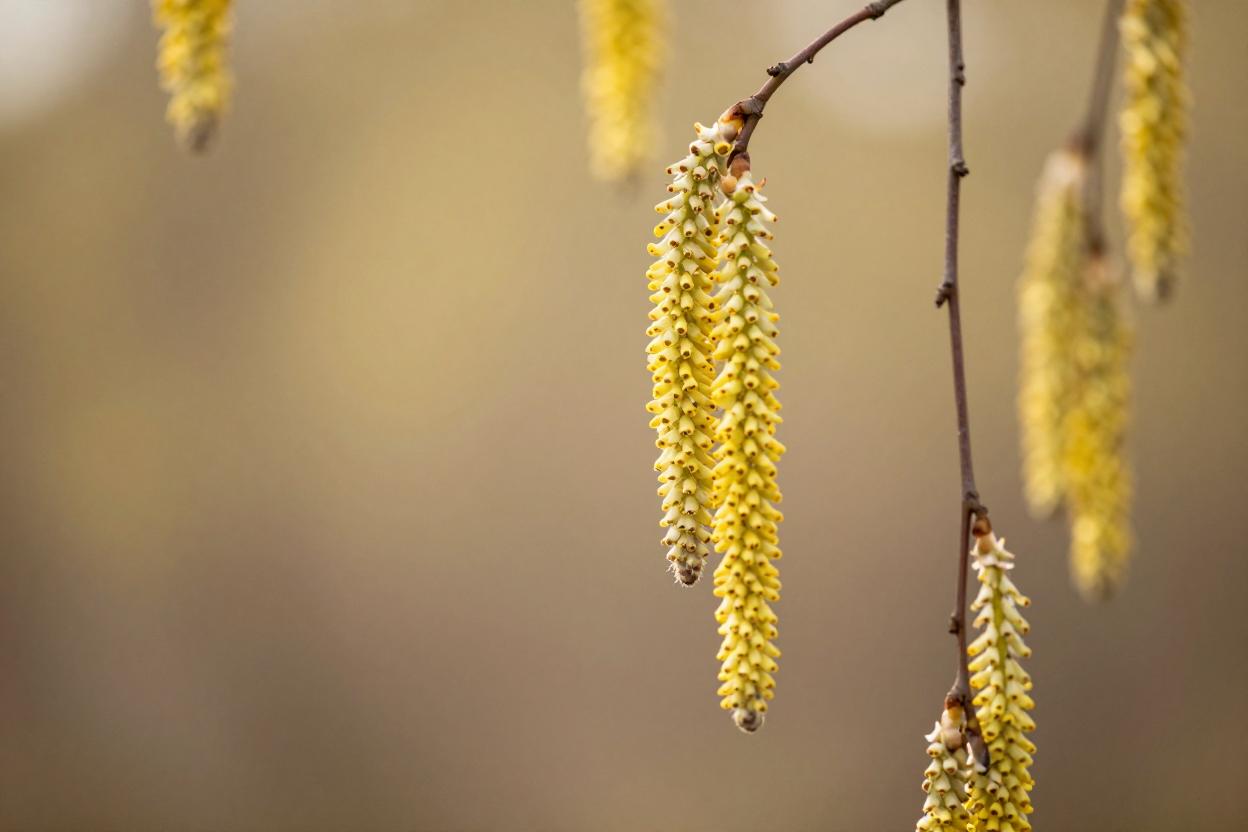 Birch: Low
 Dust: None
Updated 1 hour ago.

Pollen & dust at a glance
For anyone with hay fever, asthma or sensitive lungs, knowing what is drifting through the air today is not a nice-to-have — it decides whether the walk to the shop is a pleasure or a punishment. We track the three things most likely to bother people around Monkton Heathfield: grass pollen, tree (birch) pollen, and Saharan dust carried thousands of miles on the wind.
What today’s levels mean
Each is reported as Low, Moderate or High using Met Office style thresholds. Low — almost everyone can relax and enjoy being outside. Moderate — hay fever sufferers may notice symptoms, especially on dry, breezy days. High — the gritty end of the scale; medication before symptoms start beats chasing them afterwards, and drying laundry outdoors is best postponed.
Living with the seasons in Somerset
Each irritant has its own timetable. Grass pollen runs late spring to midsummer; birch peaks around March to April. By October our valley is mercifully quiet on both counts — but autumn brings the wildcard: Saharan dust episodes, where fine particles swept up from Africa fall with the rain, leaving an orange film on your car and gloriously vivid sunsets. Most people barely notice; those with chest conditions can feel it.
How we get the numbers
We combine forecast pollen and dust data for our exact coordinates with data from our own weather station — because rain washes pollen out of the air, a wet afternoon in the village can matter more than any regional forecast. The live widget below updates throughout the day; tap any level for the fuller picture.
Today’s Vitamin D data
Why Vitamin D matters
Vitamin D keeps bones, teeth and muscles healthy, and supports the immune system through the winter months. Our bodies make most of it ourselves — but only with help from sunlight. Between roughly October and March, the sun sits too low over Monkton Heathfield (51°N) for our skin to manufacture any Vitamin D at all, no matter how bright the day looks.
How we assess it
The rule of thumb is simple: when the sun’s UV Index reaches 3 or above, skin can produce Vitamin D. Below 3, no synthesis happens. We watch the day’s peak UV forecast for our area and report whether the threshold was reached — in high summer that’s most days from late morning onwards; in deep winter, none at all.
What today’s assessment means
Synthesis possible — the sun is high enough for your skin to make Vitamin D today. Fair-skinned people need only a few minutes of midday sun on forearms and lower legs; dark skin needs longer. There’s no need to burn — short and steady beats long and lobster-red.
No synthesis — the sun won’t contribute any Vitamin D today. Nothing wrong with the sunshine; it’s simply the wrong angle. This is normal for Somerset from autumn through to spring, and it’s why the NHS advises everyone in the UK to consider a daily 10 microgram (400 IU) Vitamin D supplement during the winter months. Dietary sources — oily fish, eggs, fortified foods — help, but sunlight and supplements do most of the work.
If you think you may be deficient, your GP can arrange a simple blood test — fatigue, aches and low mood are worth mentioning.
No flood alerts or warnings currently in force for our area.
Historical flood records are maintained by the Environment Agency.
View historical data here.
River gauge locations marked by state colour (green = low, blue = normal). Stations reporting elevated levels show red with a pulsing ring. Monkton Heathfield is marked in purple. Tap a marker for details, or view the gauges below.
None of the Environment Agency’s monitoring stations sits directly inside Monkton Heathfield, but the River Tone and its tributaries flow through the same Somerset Levels aquifer that drains our lanes. The gauges shown here are the closest available — upstream at Bathpool and Bishops Hull, downstream at Taunton Market, plus the Northmoor and Currymoor drains that feed the Levels. If levels rise on these rivers, the risk reaches Creech St Michael and Ruishton within 24–48 hours depending on rainfall intensity. Watch the ‘Steady’ vs ‘Rising’ trend indicator below each gauge; a rising arrow is your earliest warning that conditions are deteriorating.
Green (LOW): River levels are in their normal winter range. No action needed — enjoy the outdoors. Blue (NORMAL): Levels are higher than minimum but well within safe bounds — still no concern. Red (ELEVATED/WARNING): Levels have breached the normal band; if you live on low ground near Creech, Ruishton, or the A378 corridor, start paying attention. Check back every 6–12 hours and consider preparing property if multiple gauges show ‘Rising’. The warning widget on the Today page will alert you when official EA warnings activate.
The Somerset Levels enter their high-risk period from late October through March. During prolonged wet spells, the ground saturates, drainage capacity drops, and river levels climb quickly. The Met Office/Environment Agency 5-day flood outlook may intermittently show as ‘temporarily unavailable’ — that’s a data feed limitation, not a signal that risk has vanished. Keep checking this tab regardless, and monitor the warning widget on the Today page for official alerts.
Reservoir Levels — Regional Water Resources
This page shows the current storage level of Wessex Water’s surface reservoirs, updated weekly from the company’s corporate water resources report. The figure represents a regional aggregate across the Wessex Water service area — not a single local reservoir.
Reservoirs form the strategic surface-water reserve for the wider region. About 74–75% of Wessex Water’s supply comes from groundwater (Chalk and Great Oolite aquifers), so these reservoir levels mainly signal regional water stress rather than immediate local supply constraints.
The current storage level is shown in the panel below, updated weekly from the company’s published figures. This autumn has been notably dry so far — September rainfall was 64% of the long-term average, with April–September cumulative totals at 65% of average, contributing to the low levels now being recorded.
The colour bands shown below Red below 20%, Amber 20–35%, Green above 35% reflect Wessex Water’s drought-trigger language for regional water stress.
Current reading: 28% storage (Week Commencing 2 Nov).
This figure represents the aggregate storage level across Wessex Water's surface reservoirs in the regional supply area. Approximately 74–75% of Wessex Water's total supply comes from groundwater, with reservoirs serving as a strategic surface-water reserve.
Trending
Climate trends are important, reservoir levels are hugely important to our community, so this chart builds week by week from Wessex Water’s public reports. It records every reading we publish, commencing October 2026. There’s no rolling window — once a point is here, it stays. Over time the picture grows, turning individual snapshots into a local history you can trust.
Monkton Heathfield Weather is an amateur site provided for general interest only. Live data, warnings and environmental information are given without guarantee. For decisions about weather, flooding or air quality, please refer to the Met Office, the Environment Agency or DEFRA UK-AIR. Our full disclaimer is [here].